Not All Traps Are Created Equal
Trap draw affects outcome — and the data proves it. Across thousands of greyhound races at UK tracks, certain traps consistently produce more winners than others. The differences aren’t marginal. At some venues, the best-performing trap produces winners 20% to 25% of the time, while the worst-performing trap might manage only 12% to 14%. In a six-dog race where a perfectly even distribution would give each trap a 16.7% share, those deviations are significant.
This isn’t superstition or punter folklore. Trap bias is a structural feature of greyhound racing, rooted in track geometry, the physics of how dogs leave the boxes, and the position of the hare rail relative to the starting traps. Every licensed UK track has measurable trap advantages, and serious bettors treat these statistics as a baseline input for every selection decision.
The mistake that casual punters make is either ignoring trap statistics entirely — treating every starting position as neutral — or overreacting to them, backing dogs from the “best” trap regardless of form or ability. Neither approach produces profit. Trap bias is a filter, a piece of contextual evidence that adds weight to or subtracts from a selection based on other factors. Used correctly, it sharpens your analysis. Used in isolation, it’s just another way to lose money with conviction. The question is never whether trap bias exists — it demonstrably does — but how much weight it deserves in any given race on any given night.
Get more race analysis at greyhoundresultstoday.
What Trap Bias Is and Why It Exists
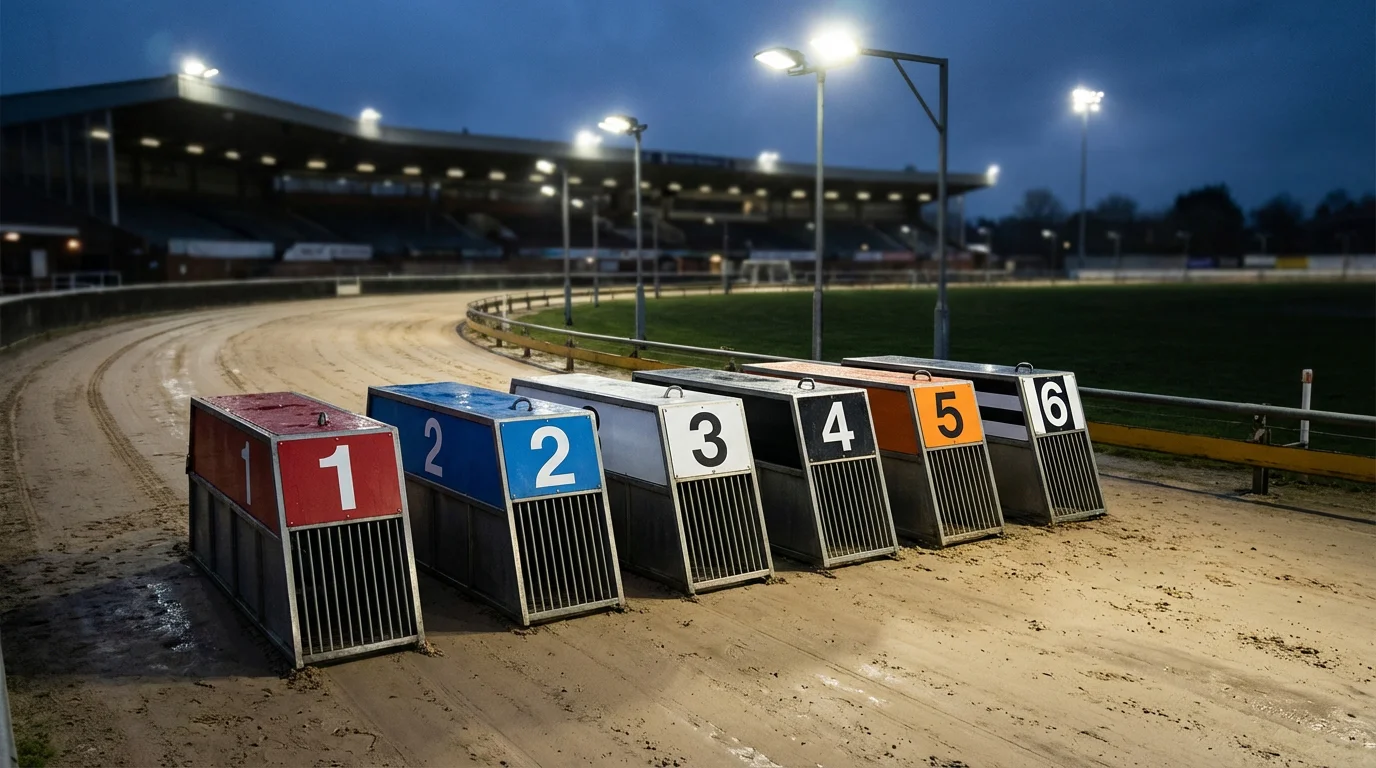
Track geometry, bend angles, and rail proximity all create inherent advantages. The six starting traps at a greyhound track are numbered 1 (innermost, closest to the rail) through 6 (outermost). When the traps spring open and the dogs accelerate toward the first bend, their starting position determines several things: how much ground they need to cover to reach the rail, how much room they have to run straight before the bend forces them to adjust, and how many other dogs they need to navigate around.
Trap 1, being closest to the inside rail, gives a dog the shortest path to the first bend. On tracks where the run to the first turn is short, this is a substantial advantage. The trap 1 dog can hug the rail, take the bend on the tightest line, and emerge into the back straight with a positional lead even if it isn’t the fastest runner in the field. This explains why trap 1 is statistically the best-performing box at a majority of UK tracks — not all, but most.
Trap 6, the outside draw, offers a different kind of advantage at certain venues. On tracks where the run to the first bend is longer, the outside dog has time to use its speed to cross the field and establish position before the turn. At these tracks, the bend is less sharp or further from the boxes, and the extra ground covered by the wide runner is offset by cleaner running through the first turn. Romford, for example, has historically shown a relatively strong trap 6 performance because of its track configuration.
The middle traps — 3 and 4 in particular — are generally the most disadvantaged across UK venues. Dogs in these positions face the worst of both scenarios: they’re too far from the rail to hug it cleanly through the bend, and too far from the outside to find clear running. First-bend crowding affects the middle boxes disproportionately, and the data reflects this with lower win percentages in traps 3 and 4 at most stadiums.
Beyond the first bend, other structural factors sustain or reduce trap advantages. Tracks with long back straights allow fast dogs from any draw to recover from a poor start. Tight tracks with multiple bends amplify the positional advantage gained from a favourable box draw. The surface condition matters too — a heavier going track slows pace and makes positional advantage more important, while fast going on a dry surface favours raw speed regardless of draw.
The hare rail also plays a role. At UK tracks, the lure runs on an inside rail, which means dogs drawn nearest the rail (traps 1 and 2) can track the hare most naturally. Dogs on the wide outside may drift further from the lure path, particularly through the bends, and this affects their running line and efficiency. It’s a subtle factor, but over hundreds of races it contributes to the statistical picture.
Trap Win Rates Across UK Tracks
The numbers vary dramatically from one stadium to the next. While detailed season-by-season statistics are available from data providers like Greyhound Data and Timeform, the broad patterns are consistent enough to outline the general landscape.
At tracks with a short run to the first bend — including Crayford, Sunderland, and Doncaster — trap 1 tends to dominate. Win percentages for the inside box at these venues typically exceed 20%, sometimes reaching 23% or 24% across a full calendar year. Trap 2 usually follows as the second-most successful, benefiting from proximity to the rail without the extreme inside position. Traps 5 and 6 at these short-run tracks often record the weakest numbers, finishing below 14%.
At tracks with a longer run — Towcester being the prime example, along with Nottingham and Hove — the trap distribution is more balanced. Trap 1 still performs well, but traps 5 and 6 close the gap significantly. At some of these venues, trap 6 periodically outperforms the middle traps over a sustained sample. The longer run gives outside dogs time to establish their position, reducing the inside bias that dominates short-run tracks.
A rough generalisation across the UK landscape, based on multi-year aggregated data:
| Trap | Average UK Win % | Typical Strongest At |
|---|---|---|
| Trap 1 | 19–22% | Short-run tracks (Crayford, Sunderland) |
| Trap 2 | 17–19% | Most tracks, generally second-best |
| Trap 3 | 14–16% | Balanced tracks with wider bends |
| Trap 4 | 13–16% | Rarely dominant, occasionally neutral |
| Trap 5 | 14–17% | Longer-run tracks (Towcester) |
| Trap 6 | 14–18% | Long-run tracks, wide first bends |
These figures are indicative ranges, not fixed values. Individual track data fluctuates year on year based on the specific dogs racing, surface changes, and weather patterns. The important takeaway isn’t the precise numbers but the existence and direction of the bias. Before betting at any UK greyhound track, check the current season’s trap statistics for that venue. Most serious greyhound data services provide this breakdown, and it takes less than a minute to consult.
How to Factor Trap Bias Into Selections
Trap stats are a filter, not a selection tool. The trap number should never be the primary reason you back a greyhound. A poor dog in trap 1 is still a poor dog. What trap statistics offer is confirmation or caution on top of your form-based assessment.
Here’s the practical approach. You’ve analysed the racecard and identified two dogs with roughly equal claims on form, time figures, and recent consistency. One is drawn in trap 1, the other in trap 4. At a track where trap 1 has a 22% win rate and trap 4 has a 14% rate, the positional advantage tilts toward the first dog. It doesn’t guarantee the outcome, but it adds a structural edge that the form alone doesn’t reveal. If the prices are similar, the trap 1 dog becomes the selection. If the trap 4 dog is significantly bigger in the market, the price might compensate for the positional disadvantage — and that becomes a value judgment.
Trap bias also informs forecast and tricast construction. Knowing which positions produce strong first-bend exits helps you predict the running shape of a race. At a heavy trap 1 track, building a forecast around the inside dog as the likely leader and a strong finisher from any draw as the second makes structural sense. At a more balanced track, the forecast becomes more open and the case for combination coverage strengthens.
Where punters go wrong is using trap statistics to override clear form advantages. If the best dog in the race on every metric — time, consistency, grade, running style — is drawn in the statistically weakest trap, the form evidence should carry more weight than the trap data. A fast dog from a weak draw can still win; the stats only suggest it wins less often, not that it can’t. The reverse applies too: a weak dog in a strong trap gets a positional benefit, not a performance upgrade.
When the Numbers Lie — Small Samples and Changing Conditions
A 60% strike rate from trap 1 sounds impressive until you realise it came from 10 races. Small sample sizes are the most common trap — no pun intended — in statistical analysis of greyhound racing. A new season brings different dogs, different conditions, and sometimes track modifications that shift historical patterns.
Reliable trap statistics require large sample sizes, ideally hundreds of races per trap at each distance. Year-end data from a full calendar of racing at a busy track provides this. Mid-season data or statistics from tracks that race infrequently can be misleading. A track that runs two meetings per week generates enough data to draw conclusions within a few months. A track that runs once a week needs a full year before the numbers stabilise.
Track surface changes also disrupt historical bias patterns. When a track is resurfaced, the grip characteristics alter, which affects how dogs accelerate from the boxes and navigate the bends. An inside bias might weaken if the new surface provides better traction on the wide line. Conversely, a surface that’s become worn and heavy may amplify the advantage of the shortest route. After any reported surface change at a track you bet on regularly, treat the existing trap data as provisional until a new sample forms.
Weather and going conditions introduce further variability. A track that’s firmly trap-1-biased in dry conditions might see that bias moderate in wet weather, when the inside rail becomes churned and slower. Rain doesn’t change the geometry, but it changes the surface, and the surface is what translates geometry into trap advantage. Checking the going report before applying historical trap data isn’t paranoid — it’s thorough.
Also read our greyhound sectional times.
The honest conclusion about trap statistics is that they’re one tool in a larger toolkit. They provide a probabilistic edge when the sample is large, the conditions are stable, and the form analysis has already done its work. They cannot substitute for studying the dogs, understanding the grade, or watching how a race unfolds. The punter who checks trap stats after completing their form assessment is using the data wisely. The punter who checks trap stats instead of doing their form assessment is gambling on geometry and hoping for the best.